Been “experimenting” with PowerBI lately and gotta admit, I kinda like it! I am not a data sciency kinda guy but I can appreciate a nice dashboard that can supply data at a glance. During my experimenting I have used PowerBI to plug into all sorts of data, from Citrix, to AD to CSV files and databases. Today I will show you what I did around VMware using a PowerBI streamed dataset (API). At time of writing, this feature is in preview, but it works so gets my vote for production deployment! 🙂
My first thought was to plug directly into the vCenter database. All my vCenters are appliances that are using the built-in PostgreSQL DB. PowerBI does have a connector for this DB so it is an option. However, upon further reading it looks like I needed to modify some config files on the appliance and install some powerbi software to make the connector work. All doable, but VMware does not officially support the changes needed to vCenter to allow remote database access. As a result I was hesitant to mess with production vCenter. No doubt it would work and everything would be fine but I had to take of my cowboy hat and be a good little architect (my boss might read this! 🙂 ) and find a supported path. I tried several different methods to access the data I wanted. For this post we will used the API method.
Streamed datasets in powerBI is a fancy name for API post. Basically we are collecting data and using a REST post operation to post the data into PowerBI. For this to work you will need a PowerBI Pro subscription. Streamed datasets, from what I can tell, are only available on the cloud version of PowerBI, so the desktop app and free edition wont work for this method.
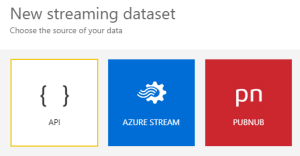
To get started login to PowerBI (https://powerbi.microsoft.com). In the top right corner, under your pretty photo, will be a Create button. Click that and select streaming dataset.

Select API and click next.
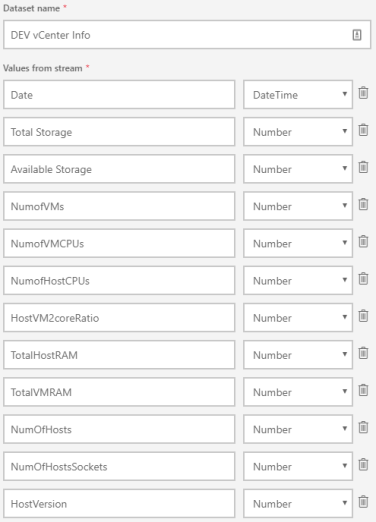
Next you will see a screen like this. You need to fill out each field that you plan to post data to. Fill in the info and click create.
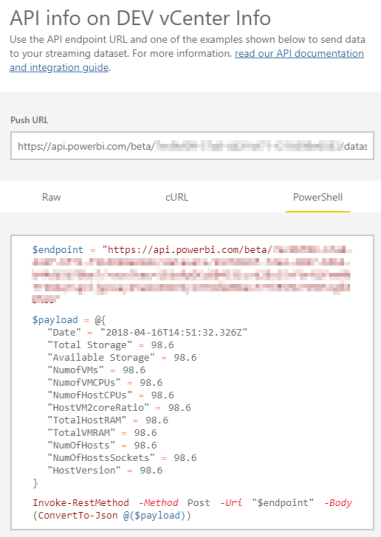
Next you will be presented with a screen that displays the info you need to post data. Select the powershell tab and copy the code output. Will will use this later.
Now we need to create a powershell script that will connect to vCenter and pull the data we need. This script will pull the data from vCenter using PowerCLI and then do a post to PowerBI. (squirrel* why are all these product names starting with power? Is it supposed to make me feel powerful?) Anywho, here is the script I wrote to get this done:
$vcenter = "vcenter host name"
$cluster = "cluster name"

Import-Module VMware.VimAutomation.Core
Connect-VIServer -Server $vcenter

#This line passes creds to the proxy for auth.  If you dont have a PITA proxy, comment out.
[System.Net.WebRequest]::DefaultWebProxy.Credentials = [System.Net.CredentialCache]::DefaultCredentials

$date = Get-Date
$datastore = Get-Cluster -Name $cluster | Get-Datastore | Where-Object {$_.Type -eq 'VMFS' -and $_.Extensiondata.Summary.MultipleHostAccess}

$hostinfo = @()
        ForEach ($vmhost in (Get-Cluster -Name $cluster | Get-VMHost))
        {
            $HostView = $VMhost | Get-View
                        $HostSummary = "" | Select HostName, ClusterName, MemorySizeGB, CPUSockets, CPUCores, Version
                        $HostSummary.HostName = $VMhost.Name
                        $HostSummary.MemorySizeGB = $HostView.hardware.memorysize / 1024Mb
                        $HostSummary.CPUSockets = $HostView.hardware.cpuinfo.numCpuPackages
                        $HostSummary.CPUCores = $HostView.hardware.cpuinfo.numCpuCores
                        $HostSummary.Version = $HostView.Config.Product.Build
                        $hostinfo += $HostSummary
                    }

$vminfo = @()
            foreach($vm in (Get-Cluster -Name $cluster | Get-VM))
        {
                $VMView = $vm | Get-View
                $VMSummary = "" | Select ClusterName,HostName,VMName,VMSockets,VMCores,CPUSockets,CPUCores,VMMem
                $VMSummary.VMName = $vm.Name
                $VMSummary.VMSockets = $VMView.Config.Hardware.NumCpu
                $VMSummary.VMCores = $VMView.Config.Hardware.NumCoresPerSocket
                $VMSummary.VMMem = $VMView.Config.Hardware.MemoryMB

                $vminfo += $VMSummary
            }

$TotalStorage = ($datastore | Measure-Object -Property CapacityMB -Sum).Sum / 1024
$AvailableStorage = ($datastore | Measure-Object -Property FreeSpaceMB -Sum).Sum / 1024
$NumofVMs = $vminfo.Count
$NumofVMCPUs = ($vminfo | Measure-Object -Property "VMSockets" -Sum).Sum
$NumofHostCPUs = ($hostinfo | Measure-Object -Property "CPUCores" -Sum).Sum
$HostVM2coreRatio = $NumofVMCPUs / $NumofHostCPUs
$TotalHostRAM = ($hostinfo | Measure-Object -Property "MemorySizeGB" -Sum).Sum / 1024
$TotalVMRAM = ($vminfo | Measure-Object -Property "VMMem" -Sum).Sum / 1024 / 1024
$NumOfHosts = $hostinfo.count
$NumOfHostsSockets = ($hostinfo | Measure-Object -Property "CPUSockets" -Sum).Sum

## This section is where you paste the code output by powerBI

$endpoint = "https://api.powerbi.com/beta/..."
$payload = @{
"Date" = $date
"Total Storage" = $TotalStorage
"Available Storage" = $AvailableStorage
"NumofVMs" = $NumofVMs
"NumofVMCPUs" = $NumofVMCPUs
"NumofHostCPUs" = $NumofHostCPUs
"HostVM2coreRatio" = $HostVM2coreRatio
"TotalHostRAM" = $TotalHostRAM
"TotalVMRAM" = $TotalVMRAM
"NumOfHosts" = $NumOfHosts
"NumOfHostsSockets" = $NumOfHostsSockets
}
Invoke-RestMethod -Method Post -Uri "$endpoint" -Body (ConvertTo-Json @($payload))
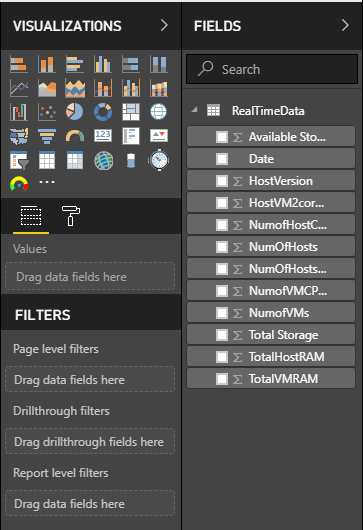
Now that we have data in the dataset you can create the report. Click the create button in powerBI (the one under your pretty picture) and click report. It will ask your to select a dataset, select the one we just created.
In the fields selection area you will see all the datapoints we setup in the dataset. Each one should contain the data that we just posted via the powershell script.
I am not going to get into how to use powerBI during this post as there are plenty of google-able blogs that have already been written on the topic. But for a quick example, this is what my initial report looks like.

The sky is the limit here when it comes to how you present the data and build your report. PowerBI is a really neat (and currently cheap) tool that Microsoft offers to build good looking dashboards and reports. This example is just what I started with in an attempt to play with streamed datasets. You can add/remove as many data points as you want to build this report out as you wish. You can also use this method on other stuff outside of just VMware. VMware is just the product I choose to test with.
Some limitations to this method.
- once data post into the dataset it cannot be removed. Streamed datasets are a preview feature at time of posting so this may not be true in the future.
- data is not real-time. Only refreshes when the powershell script runs.
- PowerBI cannot manipulate data, only report on it. If it can I have not found it yet. This means you cannot do math on two sets of data to come up with a third datapoint. Thats why you see math being done via powershell and then posting the result to powerBI for reporting. pCPU to vCPU ratio is a good example of this.

Thanks for providing this. I ran the powershell script that uploads the data to the cloud, but when I looked for the data set, there wasn’t one. I can’t tell if the issue is with collecting the data or if there was an issue porting it to the cloud. Any thoughts on troubleshooting this would be greatly appreciated.
LikeLike
The powershell script will not create the dataset in powerbi for you, that part has to be done manually then the powershell script will update the dataset with data. The first 4-5 steps of the blog show how to create the dataset before running the powershell script, did you complete that part first?
LikeLike
I found the missing piece. There is a setting at the bottom of the streaming dataset called “Historic Dataset Analysis” that has to be turned on as it is set to off by default. Once I turned it on, I was able to see the data in PowerBI. Now to figure out what other fields can be brought into session and displayed.
Since this is just a snapshot in time, any thoughts around porting the data in a sql db to display historical data?
LikeLike
Hey Jonathan,
I’m curious if you’ve noticed the date that gets pushed into power bi is inaccurate? The date that powershell pulls is entirely different than what appears in power bi for me personally. I’m not sure if this is an issue with power bi or with the date variable in the powershell script
LikeLike
I didn’t notice a time discrepancy but really wasn’t looking at the time stamps. Wonder if its a conversion thing, maybe you are feeding it a date that it is translating into UTC. Bounce one of your timestamps against UTC and see if it converts to what you see in powerbi. Google can translate it for you, just search for something like “5:35 pm est to utc”.
LikeLike
I saw this too, and it’s super annoying. It looks like the cloud version of Power BI converts everything to GMT. So I had to adjust my PS script to subtract for hours for things like session times. I want to try just passing date/time as text and see if that work. But I don’t know if that is good for writing time graphs.
LikeLike